This class of bispecifics has been the talk of the immuno-oncology town for some time. No, the world probably doesn't need another opinion on it. Yes, it makes for a great case study around which I can build the analytics around a decision support tool like cartanis.
I started with the question of how BD teams should be navigating the PDL1xVEGF landscape and I wanted to see if I could come up with a better answer than "naked" Claude.
So, if you'd like, go spin up your favorite agent and ask it in whatever manner you'd like, turn on high thinking if tokenmaxxing is still in vogue when you read this. I'd love feedback on any interesting angles my analysis misses.
My approach:
First of all, I don't just want an agent to say "go buy asset XYZ." I also don't want to just show a red/yellow/green matrix of assets vs criteria from which the user has to infer the next steps. I am building cartanis to recommend concrete actions the hypothetical BD team can take based on the information they have. For example:
Interview KOLs
Buy a proprietary dataset
Wait for the target or competitor clinical readout
Reach out to target company to solicit information
In this way, we're not just enabling decisions around which assets look the most "green" ("what should I buy?"), we're guiding decisions around which actions would give us more confidence in that scoring. Identifying reds which are most prone to flipping green with a cheap experiment ("where can we find hidden pockets of value?") and vice versa, green to red ("where should our diligence focus?"). How do we automate this?
To answer these kinds of questions, cartanis uses:
A "pareto frontier" representation of the standard of care (read more from Formation Bio on this) across relevant tumor types
Estimates of future frontiers based on the known pipeline and existing data, and probability of success estimates for each program
Estimates of uncertainty around both the future SOC and the asset in question
A catalog of activities which can resolve those uncertainties
I look forward to talking about those modules in future posts, but today's focus is the answer to the PD-(L)1×VEGF question: Claude Opus 4.8 drafted the report below using a human-guided workflow built on top of cartanis. The animations were human-conceived, and Claude built. Em-dashes are all Claude. And frankly… I cheated a decent bit. The blog post took several iterations to get to this point: the next analysis will materialize with less guidance as each workflow improves.
Finally, I was at first tempted to replace the exact numbers produced from cartanis with directional statements, but a good friend once told me that the best way to get the right answer is to say the wrong one loudly in public. I'm accepting that cartanis is a work in progress, and I've included at the bottom of the report a sensitivity analysis of the various models' current outputs vs the post's conclusions, and how those outputs compare to analyst estimates. There will even still be blind spots, and I welcome your feedback at alex@cartan.is
-- Alex
Not another PD(L)1×VEGF POV
cartanis (Claude Opus 4.8), edited by Alex Goldberg
The five most-advanced PD-(L)1×VEGF bispecifics are already partnered, and the 2024–25 land-grab has gone quiet. On the public data, waiting for ivonescimab's overall-survival readout is the rational move, which is why the deal flow stopped.
But the deals that will define this class are being shaped now, on private translational reads of that readout and on quietly locked options. The public scoreboard says wait. What matters is who already has the edge to move before it changes. Below: what each kind of asset is worth, who buys what and when, and the moves that build an advantage today.
The top shelf is spoken for, but the biggest prize isn't off the board. Four assets are locked with committed large-caps. The fifth — ivonescimab, partnered to Summit — is reachable by buying Summit outright.
One catalyst rules the board: ivonescimab's Western overall survival (HARMONi-3, vs Keytruda+chemo). Everything positive so far is China data against weaker comparators — that risk may be up to 50% according to the market.
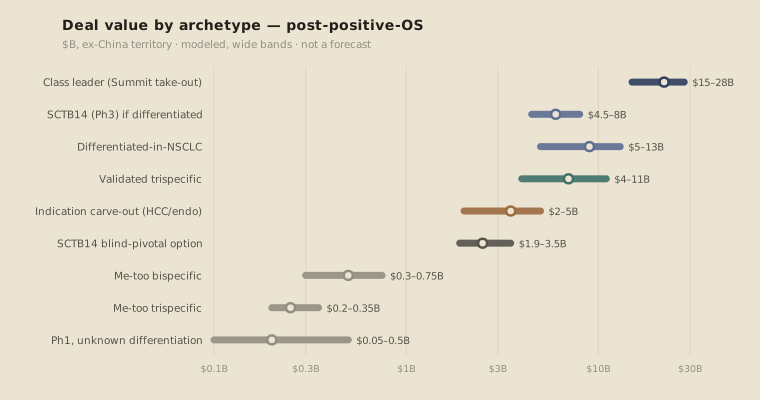
Deal values swing on that readout (modeled, wide ranges):
a de-risked class leader: ~$15–28B
a differentiated-in-NSCLC asset: ~$5–13B
first to market in a different tumor (HCC, endometrial): ~$2–5B
a me-too: a few hundred million
a Phase-1 unknown: option-pennies
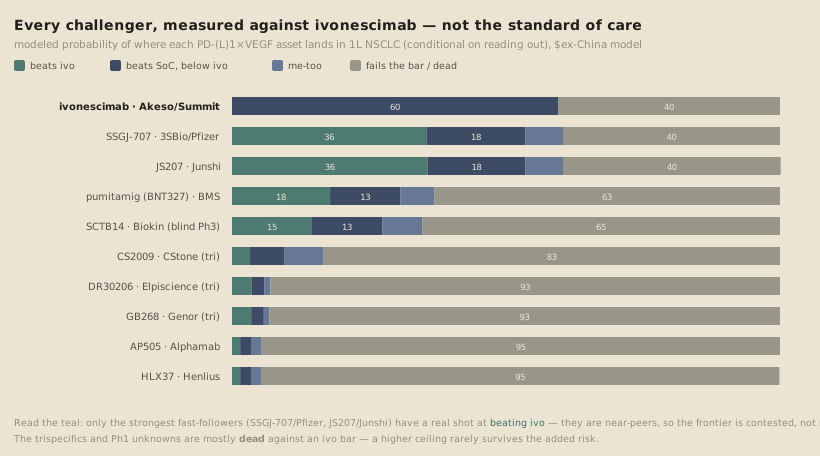
The frontier is contested: the strongest fast-followers, SSGJ-707 (Pfizer) and JS207 (Junshi), have a real (~35%) shot at beating ivonescimab, so the leader's value is compressed by the field even if it ultimately wins.
The credible buyer pool is thin. AstraZeneca is the named front-runner; Roche and a few wildcards round it out; Merck, BMS, Pfizer and AbbVie are off the leader board for now, each already holding a rival asset.
A buyer's edge is analytical:
a proprietary translational read on whether the China data holds in the West (worth ~$1.5–3B in our model, and it beats waiting);
exclusive intel on the blind Phase 3, SCTB14 — the highest value-of-information target in the class.
A challenger's edge is clinical: because the frontier is anchored to ivonescimab, differentiation is won in trial design — indication prioritization, comparator choice, biomarker enrichment — the highest-return move for the Phase-1 assets. Positioning sells the asset you have; clinical prioritization builds a better one.
Wildcard: a reported ~$400B AstraZeneca–Bristol Myers merger would take the class's front-runner buyer off the board — one analyst reads it as AZ getting a PD-(L)1×VEGF (BMS's pumitamig) rather than buying Summit. If it happens, the hit is narrow: a lower clearing price for the leader take-out, with the differentiated and carve-out lanes largely insulated. Full read in the buyer registry.
01Five are partnered. What's actually reachable?
show / hide↓
what's actually reachable
Nineteen disclosed assets. Four are locked behind committed owners and one — ivonescimab — is reachable only by taking out Summit. Everything else is the unpartnered tail: mostly Chinese-originated, mostly Phase 1–2, mostly without differentiating data.
one readout decides the class
The catalysts aren't equal. The November PDUFA is just ivonescimab's own US approval decision — it moves ivonescimab's launch timing, not the class. The master switch is ivonescimab's Western overall survival — HARMONi-3 (ivonescimab+chemo vs Keytruda+chemo, 1L NSCLC, squamous and non-squamous). Its squamous PFS interim already stumbled; the OS is what counts — a squamous interim in 2H 2026, the definitive all-comers result in 2027 — and whether ivonescimab's China wins translate there is what the whole class rides on. Then each asset's own data, then the other-tumor readouts that size the opportunity.
price the archetype, not the asset
Pre-data, most of these assets are indistinguishable from their peers. So you value the archetype they fold into — leader, differentiated, carve-out, data-blind option, me-too, early-stage optionality — and pay for the option, not a name it hasn't earned yet.
what each archetype is worth
Once an asset's data resolves it, the bands are wide — but because differentiation is now measured against ivonescimab, not the old standard of care, the top no longer separates cleanly. A class leader sits at $15–28B; a differentiated-in-NSCLC asset — one that clears the ivonescimab bar — at $5–13B, rising into leader money if it actually beats ivo (the strongest fast-followers, SSGJ-707 at a modeled ~$13B and JS207, are near-peers that could); a carve-out — first to market in a different tumor, HCC or endometrial, winning a smaller arena against that indication's own standard of care — at $2–5B; a me-too at a few hundred million; and the Phase-1 tail at option-pennies.
who can actually buy
Only a handful of large-caps can take the leader — capacity and a reason to want a next-gen IO backbone. AstraZeneca is the front-runner, with Roche and a wildcard or two (J&J) behind it. Merck, BMS, Pfizer and AbbVie are out — each already holds a rival PD-(L)1×VEGF. Regeneron and the mid-caps map to the cheaper, differentiated lane. The two axes are the buyer registry's read (C6): capacity from balance-sheet firepower, urgency from patent-cliff and franchise-defense pressure.
who buys what — and the edge
Cross the buyers against the archetypes and the fits are narrow. With no buyer forced to move, the seller's game is two-fold: manufacture urgency, and — for a challenger — improve the asset through clinical planning, since differentiation is measured against ivonescimab and which indication you prioritize is the highest-return move. The buyer's edge is a sharper translational read on the OS and exclusive intel on the blind Phase 3 (SCTB14) — plus structure (a readout CVR) to act before the crowd.
A coarse, uncertainty-native landscape read. Dollar figures are modeled estimates shown as wide ranges (never point forecasts); clinical data, deal terms, and dates are sourced and linked. Nothing here is investment advice.
Deep dive
C1. The asset universe & rights map
Nineteen disclosed assets; the question is which are reachable and at what stage. We sort rights into three states, and a partnered asset can still be in play:
🔴 Partnered & locked (global/ex-China taken by a committed large-cap — not reachable):
pumitamig (BioNTech→BMS), SSGJ-707 (3SBio→Pfizer), LM-299 (LaNova→Merck), RC148 (RemeGen→AbbVie).
🟡 Partnered but in play (a partner exists, but the valuable rights — or the whole company — are gettable):
ivonescimab (Summit holds ex-China; Summit itself is the take-out), CR-001/SKB118 (Kelun holds Greater China; Crescent retains ex-China/US), MHB039A (Qilu holds Greater China; Minghui retains ex-China).
That land-grab was not cheap. Between December 2022 and January 2026, five of these assets partnered at roughly $500M–$1.5B upfront and $3.3–11.1B in total deal value — the froth premium of a validated hypothesis bid up by multiple buyers. The actual terms, and the population comps they cleared, are in the deal-comps appendix.
ivonescimab
Summit / Akeso · partnered — in play
format IgG1 tetravalent, Fc-silent
stage Phase 3
data PFS HR 0.51 (China, vs pembro)
Class leader
JS207
Junshi · unpartnered
format IgG4 tetravalent (VHH)
stage Phase 2/3
data NSCLC ORR 58% · HCC ORR 46%
Carve-out (evidence-backed)
CS2009
CStone · unpartnered
format Trispecific +CTLA-4
stage Phase 2
data NSCLC ORR 81% (PD-L1 high)
Trispecific — with data
SCTB14
Sinocelltech · unpartnered
format Undisclosed
stage Phase 3 pivotal
data No disclosed data
Data-blind option
IMM-2510
ImmuneOnco · unpartnered (reverted)
format PD-L1×VEGF-trap, Fc-competent
stage Phase 2
data NSCLC+chemo ORR 62%
NSCLC bispecific
HB0025
Harbour · unpartnered
format VEGF-trap fusion
stage Phase 2/3
data Endometrial ORR ~84%
Carve-out (endometrial)
AI-081
OncoC4 · unpartnered (US-native)
format Undisclosed
stage Phase 2 (US)
data No disclosed efficacy
NSCLC bispecific
GB268
Genor Biopharma · unpartnered
format Trispecific PD-1/CTLA-4/VEGF
stage Phase 1
data No data
Speculative trispecific
DR30206
Dermsanto · unpartnered
format Trispecific PD-L1/VEGF/TGF-β
stage Phase 2
data No data
Speculative trispecific
The in-play assets — border color is rights status (teal unpartnered, sienna partnered-but-in-play); the archetype tag is where each sits today, before its own data resolves it. Swipe →
C2. Archetypes & the catalyst cascade
We sort the assets into archetypes, each with its own deal comp. As the catalysts fire, assets split out of their archetype into distinct resolved outcomes, and the comps pull apart.
The catalysts resolve this pool in order. Two of the four tables, the ones that move value most:
Catalyst — ivonescimab OS (the master switch). No differentiation split yet; the whole board re-rates together. Positive → every archetype re-rates up, unevenly (the leader least in percentage terms, the earlier-stage archetypes far more — see the bands in §3); negative → the class collapses to salvage. This is where both the Summit rebound and the class-collapse live.
Catalyst — asset-specific POC data (the degeneracy-breaker). The archetypes split:
Archetype (before)
Resolves into
~# assets
Deal value
NSCLC bispecific (3)
Differentiated-in-NSCLC
~1
≈$5–13B
Me-too bispecific
~2
≈$0.3–0.75B
Speculative trispecific (2) + CS2009
Validated trispecific (merges w/ differentiated, less a safety cost)
~2
≈$4–11B
Me-too trispecific (tox drag)
~1
$0.2–0.3B
Ph1-unknown (5)
Differentiated / Me-too-or-dead
~1 / ~4
$0.2–0.5B / ≈$0
SCTB14 is the one to watch in the blind pile. It is the most clinically advanced of the assets that have disclosed nothing — a Phase 3 pivotal already running, with no efficacy out. A differentiated result makes it a near-launch asset in the differentiated band (≈$5–6B in our model — mid-band, since it launches later and takes less share than the leading fast-followers); a me-too result is ≈$0.5B; pre-readout you are buying the blind option — a ≈$2–3B probability-weighted blend — and you pay up the moment the card turns. What makes it the intel target is not its odds of winning — those are modest — but the value of finding out: in our model the value of a proprietary read on SCTB14 is ≈$1.2B, roughly 17× that of any other blind asset. It is the only asset that is both near-launch (so the resolved value is large) and fully blind (so a private read is genuinely exclusive, not merely early). Every other blind asset is a Phase 1 with a distant, discounted readout and little value at stake; the disclosed fast-followers have higher raw information value, but their readout is a public catalyst — you can be early, not alone. SCTB14 is where private diligence buys an edge no one else can hold.
Format never adds value on its own — only data does. A trispecific that validates in NSCLC prices like a differentiated bispecific with the same data; the extra mechanism earns nothing extra on the NSCLC opportunity itself (its own value lives in IP breadth and reach into other indications, not in the NSCLC number). What format changes is the shape of the pre-data bet, not the odds of winning it. The third mechanism can add real benefit or add toxicity and complexity that sink it, so both tails run fatter than a bispecific’s — this isn’t simply a lower chance of differentiating. And the downside cuts deeper: a trispecific that lands a me-too is worth less than a me-too bispecific, because the third mechanism becomes pure liability, added tox and cost with nothing to show for it. So a validated trispecific merely ties, and a me-too trispecific is the worst outcome on the board.
C3. The valuation engine
The deal values above are risk-adjusted NPVs over the ex-China commercial territory. In short: we size each arena, model how the competing entrants split it, and carry that revenue across an exclusivity window to a present value — then risk-adjust for the asset’s own probability of success and the class-wide OS risk. The share step is a competitive model, not a simple order-of-entry rule (who lands first matters, but so does how differentiated each entrant is and how they erode one another). It’s deliberately coarse and wide-band; the output is orders of magnitude, not forecasts.
Market anchor. 1L NSCLC dominates (≈$16B ex-China territory at full share — ~65k US 1L-IO-eligible patients at ≈$130k net/yr is ≈$8.5B in the US alone, scaled across ex-China geographies), ~4–5× any other single arena; HCC is the highest-conviction mechanistic lane (a PD-1×VEGF replicates the atezo-bev combination in one molecule); endometrial and ES-SCLC are mid-tier; the rest are niches.
A moving target. The point estimates hide comparator drift. By the time mature OS reads out (2027+), the 1L NSCLC bar won’t be today’s Keytruda+chemo. Subcutaneous Keytruda, IO+ADC combinations, and new entrants raise the target over the asset’s value horizon. We hold the backbone fixed, so the later-stage numbers likely sit toward the low end of their bands.
Deal comps & the froth premium. The five class deals ran several times the pre-2024 norm for a same-stage bispecific (on total deal value): the froth premium of a validated hypothesis in a land-grab. These deals are the PD-(L)1×VEGF comps, so the honest denominator is what bispecifics fetched before this mechanism got hot, not a generic same-stage median. Triangulated against the direct mechanism comp (a preclinical PD-1×CTLA-4×VEGF trispecific at a $20M option fee / $2B total deal value1), these archetypes are cheap options today; the multi-billion numbers are resolved-state values that an asset must earn. The froth is a spread, not a level: the 2024–25 deals cleared well above what the assets are intrinsically worth, and as the mechanism de-risks and buyers wise up, that spread compresses back toward the modeled bands. (Full terms and the population comps they cleared: the deal-comps appendix.)
Deal value by archetype once the class de-risks (log scale). The leader is a different order of magnitude; the tail is option-pennies. Wide bands by design.
A note on units — don’t sum across the bands, and don’t compare an acquisition to a milestone-loaded total. The leader figures are acquisition / enterprise values (buying Summit outright — cash paid now); the rest are licensing deal totals (a small upfront plus milestones that mostly won’t pay out). Those are different instruments, and comparing a $15–28B take-out to an $11.1B milestone-loaded license double-counts the risk that’s already discounted out of the license. To compare apples-to-apples, put them on the same footing: either upfronts — the leader take-out (≈$11B, all upfront in effect) against the class upfronts ($0.5–1.5B) — where the leader is plainly an order of magnitude larger; or risk-adjusted deal value — the leader NPV against the class deals’ upfront + probability-weighted milestones (the “risk-adj. total” column in the appendix, ≈$0.1–5.3B). Both comparisons hold the leader well clear of the field; the milestone-loaded headline total is the one number that flatters the challengers. The $15B July-2025 AstraZeneca–Summit figure was a licensing rumor, not a take-out2; it collapsed, and some analysts doubt buyers will support even that today (see the buyer registry) — the leader’s pre-OS band is the shakiest number in the piece.
Is there a flip? We tested the obvious arbitrage: buy an asset cheap before its data, fund its own readout, flip the resolved asset at the differentiated comp. At today’s froth prices it loses (central estimate around −$1B, positive in only a small minority of draws): you pay the inflated pre-data price and then eat both the class-wide OS coin-flip and the differentiation lottery. It works only if you buy below froth (a distressed seller) or with a proprietary read on which asset is differentiated. The froth already priced the buy side, so the only edge left is information.
C4. The class-failure question
How likely is it that the whole class disappoints once it faces the Western standard of care? We put it at ~25–30% (band 20–35%), a real risk. “Class failure” is three risks stacked together, and they don’t move the same way or hit the same assets:
Mechanism-translation risk: does dual PD-(L)1×VEGF blockade beat chemo-IO in a Western population at all? This is the shared risk, and it hits the whole class, me-toos included. The prior isn’t reassuring: a validated same-mechanism combo already failed on region transfer. IMpower150.3 (atezo-bev-chemo) won in the West; the identical regimen re-run in China (IMpower151) missed PFS4 The lesson isn’t that China data is inflated — it’s that the same regimen produced materially different results across regions, so a result in one is a weak predictor of the other, either direction.
Regulatory-acceptance risk: will FDA take China-heavy data? Sintilimab’s 14–1 ODAC vote5 is the precedent, and it cuts across every China-originated asset here.
Leader-execution risk: ivonescimab’s own Western readouts. The 2L EGFR HARMONi trial missed its OS primary (HR 0.79, p=0.057).6 and the HARMONi-3 squamous interim PFS missed its bar7 Weight the 2L EGFR miss carefully: post-TKI EGFR-mutant disease is a hard, biologically distinct setting, so it reads through only weakly to 1L IO-naïve chemo-combination OS, the actual value driver. It dents the leader more than the class.
The risks don’t aggregate into a single number for every asset. A me-too’s fate is dominated by the shared mechanism and regulatory risks; the leader carries its own execution risk on top. Rolling the three together, with mechanism risk doing most of the work and regulatory and execution stacked on, lands us at ~20–35%. Everything positive so far is Chinese and against weaker comparators than the US standard of care — ivonescimab’s PFS win over pembrolizumab monotherapy8 and its OS win over tislelizumab-chemo in squamous NSCLC9 are both China trials against sub-Western comparators — and whether it translates is the open bet.
C5. The competitive frontier — measured against ivonescimab
Two questions decide an asset here, and neither is “what’s its ORR.” First: conditioned on its pivotal succeeding, where does it land versus ivonescimab — not versus the standard of care? Second: what has to happen for that value to resolve?
The anchor is the reframe. Assume ivonescimab’s overall-survival data lands and its China read holds — then it is the bar, and the old standard of care stops being the thing to beat. So we score every other NSCLC asset against ivo directly: does it land above it (rare, and bad news for Summit), beat the old standard but sit below it, land a numeric me-too, or fall short of the bar and die? We model that draw per asset — using each one’s disclosed data, its development and tolerability risk, and the fact that the whole class rises or falls together on one shared mechanism.
Where each challenger lands relative to ivonescimab in 1L NSCLC (modeled, conditional on reading out). Teal = beats ivo; navy = beats the standard of care but sits below ivo; light = numeric me-too; grey = fails the bar. Only the strongest fast-followers have real teal.
The read is sharper than an archetype picture. The two strongest fast-followers — SSGJ-707 (Pfizer) and JS207 (Junshi) — model as genuine near-peers: each has a real (~35%) shot at landing above ivonescimab, because their disclosed data is statistically hard to separate from it. The external data backs this out: in single-arm Phase 2, SSGJ-707 monotherapy posted a ~62% ORR in advanced NSCLC20 and JS207 ~58% in 1L PD-L1-positive NSCLC21 — both at or above ivonescimab’s ~50% in the same setting. We don’t let that raw edge make them favorites: cross-trial single-arm ORR is a weak comparator (different populations, no randomization), and ivonescimab alone carries a randomized PFS win over pembrolizumab that the challengers can’t yet match — so the model credits them as near-peers, not front-runners. The point holds either way: the frontier is contested, not settled — a leader with two credible challengers on its shoulder, not a runaway. Everyone else thins out fast. The trispecifics (CS2009, DR30206) and the Ph1 unknowns are mostly dead against an ivo bar: a higher mechanistic ceiling rarely survives the extra development and tolerability risk, so they get killed more often than they clear. A carve-out — first to market in a different tumor (HCC, endometrial) — wins a genuinely smaller arena against that indication’s own standard of care, which is why even as a winner it’s worth a fraction of an NSCLC winner.
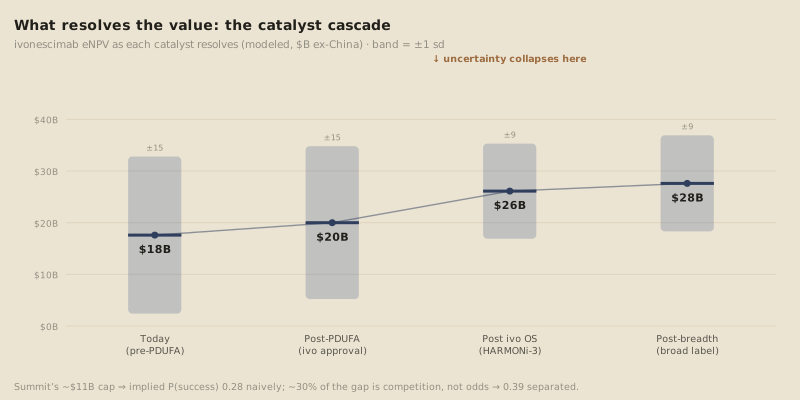
The second question — what resolves the value — is where the real money moves, and it moves on a cascade of catalysts, not all at once:
Ivonescimab’s modeled eNPV (ex-China, $B) as each catalyst lands; the band is ±1 standard deviation. Almost none of the uncertainty resolves at approval — it collapses at the overall-survival readout, which also re-rates the whole field.
Almost none of the uncertainty resolves at the FDA approval. It collapses at the overall-survival readout (HARMONi-3): that single event removes roughly 40% of the leader’s valuation variance and re-rates the entire class. Everything before it is timing; everything after is a different game — which is why the highest-value move here is usually information, not capital.
That cascade is also why Summit’s ≈$11B cap is easy to misread — though not the way it first looks. Divide the cap by a standalone, no-competition NPV and the implied probability of success reads about 0.27, as if the market were pricing ivonescimab as a coin-flip that misses. It isn’t: roughly a third of that “missing” value isn’t doubt about the drug, it’s the competition compression the model just made explicit — the near-peer fast-followers who split the arena even if ivo wins. Strip that out and the same cap is consistent with an implied success probability closer to 0.4 — which is, near enough, what sophisticated money already backs out of Summit’s own scenario range (an approval worth ≈$28–42, a failure ≈$3–5, the stock priced in between). So the market is not making the naive error; it is pricing ~0.4–0.45, and the competition compression is why that is the right number rather than the 0.27 a monopoly-NPV divide implies. Our own model is more optimistic on the science — it carries roughly a 0.7 chance the class works — and that gap, between our translational read and the market’s, is itself the prize: it is exactly what a proprietary view on HARMONi-3 resolves. (Where our estimates diverge from the Street, and why our own success odds are probably too generous, is laid out in the model-vs-Street appendix.) The sharpest single instance is the most-advanced blind asset, SCTB14 (a Phase 3 with nothing disclosed): its odds of beating ivo are modest, but the value of finding out is the highest of any blind asset by ~17× in our model — the only near-launch, fully-blind card, where a private read is exclusive, not merely early.
Safety is on-target-pathway (VEGF-driven hypertension, proteinuria, hemorrhage), so a “cleaner” molecule doesn’t fix it — and no asset here discloses per-molecule safety yet, so safety can’t differentiate them today. Only therapeutic-index plays (conditional activationread more ↗, exposure-shapingread more ↗) move it, and the class leader has already taken the obvious levers. Translation, not safety, is the decision driver here.
C6. The buyer registry
The registry below is representative, not exhaustive. It’s the large- and mid-caps with a real reason to act (or a clear reason not to), scored on the three axes that decide it: capacity for a $10B+ deal, whether they already hold a rival PD-(L)1(×VEGF), and a franchise or patent-cliff reason to want a next-gen IO backbone. A name with none of the three isn’t here.
Buyer
Can do $10B+
Owns a PD-(L)1?
Urgency
Posture
AstraZeneca
yes
Imfinzi
extend IO lead
leader front-runner (reportedly circling); patient (strong own pipeline)
Roche
yes
Tecentriq (cliff 2027)
defend NSCLC/HCC
leader or HCC carve-out
J&J
yes (deepest)
no
low — no checkpoint strategy
unlikely; has signaled away from checkpoints
Merck
yes
Keytruda (cliff 2028)
high — but holds LM-299
off the leader board; re-enters if LM-299 underwhelms
BMS
yes
Opdivo + pumitamig
committed
off the board (most committed of the four)
Regeneron
stretch
Libtayo
high — Libtayo defense (LAG-3 combo failed)
most motivated mid-cap, but capacity-gated and platform-biased → more likely to build/partner its own than buy the leader
Lilly / Novartis
yes
no
low — IO-light by choice
strategically open (no rival), but neither has built an IO franchise: capacity without appetite
Gilead / Sanofi / GSK
fast-follow
Trodelvy* / Libtayo / Jemperli
fill a checkpoint gap
differentiated fast-follow / carve-out
Takeda
levered
no
patent cliff
cheap China-license on the tail
Amgen / Daiichi
mid
no
platform
combination partners, not acquirers
The bear case sharpens the thin-pool read. The strategically-open large-caps without a PD-(L)1×VEGF of their own are a short list — beyond AstraZeneca, mainly Roche, Lilly and Novartis, with J&J a deep-pocketed wildcard.11 After the competitor deals and the HARMONi-3 miss, Leerink’s Daina Graybosch sees “few (if any) large-cap pharma companies with sufficient capital and interest to provide upfront consideration for ivo that supports [Summit’s] current valuation.”10 And the ≈$15B AstraZeneca licensing talk in July 20252 came to nothing. The top of this market has very few buyers, none of them forced to move.
A live wildcard: the reported AstraZeneca–Bristol Myers merger. In August 2026 the FT reported early-stage talks on a ≈$400B AZ/BMS combination;17 the Street is skeptical — the largest pharma deal ever, and an antitrust snarl from the Opdivo/Imfinzi and CTLA-4 overlaps.19 It matters here beyond the obvious “a merged AZ+BMS is simply both off the board.”
The non-obvious read is substitution, not subtraction. AstraZeneca has no PD-(L)1×VEGF of its own — which is exactly why it was the Summit front-runner — and a BMS merger would hand it one (pumitamig.15). Analysts have floated that as a rationale: get the mechanism without buying Summit18 If so, it doesn’t just remove a bidder — it removes the demand that made ivonescimab the prize. We doubt a VEGF bispecific is the real rationale for a ≈$400B merger — nobody underwrites a deal that size on a pre-readout asset — but the motive doesn’t change the outcome: a merged AZ+BMS would hold pumitamig either way, which removes AZ’s need to chase Summit. The effect on the leader take-out is the same whether substitution is the reason or a side benefit.
The second-order effects don’t all point the same way:
Auction-tension collapse (bearish, leader). AZ wasn’t one of N interchangeable bidders — it was the price-setting anchor the “wait for the post-OS auction” surplus rests on. Remove it and the clearing price drops even from the buyers who remain, because they know they’re less contested — sharpening the Leerink bear case and undercutting Summit’s “hold for the bump.”
Defensive consolidation (bullish, tail). A top-of-market megamerger can push rivals to bulk up. Merck is the acute case (Keytruda cliff, already holds LM-299, beaten head-to-head by ivonescimab), so appetite for a PD-(L)1×VEGF among Merck/Roche/Novartis/Lilly could rise — cutting opposite to the naive “one fewer buyer.”
Capacity drain at the worst moment (bearish, timing). A ≈$400B integration plus a three-regulator review freezes two would-be buyers and their bandwidth for 1–2+ years — right as the 2027 mature-OS de-risking is meant to trigger the demand cascade. The cascade could arrive muted.
It clips the top, not the tail. AZ was specifically the leader-archetype buyer; the carve-out and differentiated buyers (Roche, Gilead, Regeneron, Sanofi) are untouched — so the merger narrows the leader-vs-differentiated gap the whole value ladder is built on.
One tempting angle doesn’t hold: an antitrust-forced divestiture would land on a marketed checkpoint (Opdivo/Imfinzi or a CTLA-4 agent), per FTC precedent19 — not on pipeline pumitamig, which the merged entity would keep as its next-gen future. And the base case may be no checkpoint divestiture at all — the FTC has cleared overlapping marketed-IO before — which only sharpens the point: any divestiture reshuffles the legacy-IO board, not the PD-(L)1×VEGF one.
On balance, the net impact would be narrow and leader-specific: a downward repricing of the class-leader take-out — AZ was the anchor bidder, and its exit, by substitution or by the distraction of a ≈$400B integration, removes it — with the differentiated and carve-out lanes insulated and possibly firmer. It clips the top of the distribution, not the whole class.
C7. Game theory & sequencing
A few lenses, with the caveat from §4 that this is the public-information surface; the private game runs ahead of it.
What the sharp teams should be doing now. The move that matters before the OS reads out is analysis, not a bid. Build a translational read sharper than the market’s on whether ivonescimab’s China data holds in the West — from the public HARMONi record, region-transfer models, and KOL diligence, with no peek at the blinded trial required. Lock cheap options on the tail ahead of the post-OS scramble. Run diligence to separate the differentiated assets from the me-toos before their data does it in public.
Real-options and pre-emption. With no forced buyer, the pre-emption threat is weak, so the public-information move is to wait for OS. The exception is a buyer with a sharper (public-data) translational read acting before the print.
Lemons, but only where there’s no data room. For an early, data-light asset the seller knows its hand better than the buyer, so shopping early signals weakness. For a Phase 2/3 asset, diligence opens the box and largely dissolves the asymmetry; the friction moves to price and structure.
The frictions that bind. Auction dynamics (a competitive process lifts the seller’s capture), ROFR/ROFN overhangs from existing collaborations (Pfizer and GSK already have combo deals with Summit), and the CVR gap: when buyer and seller disagree on the OS, the deal is a contingent structure rather than a walk-away.
War of attrition and scarcity cascade. Post-OS, the two or three leader-buyers compete for one asset; the highest-fit bidder (likely AZ) wins and pays up. The rule is archetype-conditional, not universal: a scarce, differentiated asset can afford to wait, but the undifferentiated tail faces a depleting-buyer clock — once the first leader deal sends the losers down to fast-follows and carve-outs, the tail should move first, before the pool of willing buyers is spent.
The seller side sorts by conviction. Summit, holding its own OS conviction, won’t sell cheap; it holds for the bump (with a real sell-the-news caveat). A carve-out with data in hand should transact now, while the data is fresh. The lemons problemread more ↗ bites the early, data-light assets hardest: with little in the data room, a “differentiated-hopeful” that shops itself early looks like a me-too trying to beat its own readout — so it is pushed to prove differentiation before it commands a premium. A likely me-too should sell fast, before its own data settles the question and the last of the froth is gone.
Is waiting actually a good option? We modeled it. Treating each move as a decision, here is the buyer’s expected surplus (directional and wide-band, not a quote):
Strategy
Buyer surplus
Wait → post-OS auction
low (≈$3–5B)
Buy now, blind
lower and riskier (≈$2–4B)
Buy now on a sharper translational read
highest (≈$5–7B)
The informed buy is usually the best move, and the value of the read itself is a wide ≈$1.5–3B. Post-OS de-risking is public, so it triggers an auction that hands the gain to the seller. A buyer who reaches a calibrated view earlier captures it instead, by transacting before the auction, or by pricing a CVR that lets both sides act despite disagreeing. The same test kills the flip arbitrage (see the valuation engine).
The likely path: a quiet surface now (action at the edges: cheap tail buys, contingent structures, conviction-led moves) → partial thaw at the 2H-2026 interim → a leader auction and a demand cascade at mature OS (2027+) → resolution of the differentiated/me-too split as asset data lands.
Because the leader is priced to perfection, holding for de-risking can forfeit value to sell-the-news; and because no buyer is forced to move, edge comes from specific moves rather than patience. The seller manufactures urgency with a differentiating data cut or a competitive process before the readout. The buyer builds a calibrated translational view from public data and uses structure (a readout CVR) to act on it before the crowd. The levers are concrete: subgroup consistency across the HARMONi trials, the PD-L1 TPS strata, the squamous vs. non-squamous divergence, ctDNA dynamics, and an explicit China→US effect-size-shrinkage model — with the IMpower150→151 gap34 as the prior.
The edge — the moves available now. Most of the high-value moves are about information and tempo, not capital, and none of them wait on the OS print.
If you’re a buyer:
Build a sharper translational read than the market, on public data. Reach a calibrated view before the print and you can act while the market is still a coin-flip; in our model that view is worth ≈$1.5–3B and beats waiting.
Use structure to bridge disagreement. If you and the seller can’t agree on the OS, put it in a contingent value right or a readout-tied milestone. “Buy now with a CVR on HARMONi-3” is the third option the wait-vs-buy framing misses — though OS-based CVRs on China-origin assets are hard to adjudicate and sellers resist them, so it’s a real instrument, not a free lunch.
Lock cheap optionality now — ROFRs and options on the tail and the carve-outs — to pre-empt the post-OS demand cascade at pre-cascade prices.
Diligence the pooled assets to identify the differentiated one before the market separates it, and pay the pooled (discounted) price.
If you’re a seller:
Manufacture urgency. In a buyer’s market, passively holding a good asset forfeits value. Run a process; surface the buyer with the strongest translational conviction; make it known the leaders are circling.
Signal, don’t narrate. A differentiation story pools you with the me-toos and gets discounted. A signal a me-too can’t fake — a data cut, a head-to-head design, a mechanism-specific biomarker — separates you. Invest in it before you need to sell.
Improve the asset with clinical planning, don’t just position it. The frontier is anchored to ivonescimab, so differentiation is won or lost in trial design — which indication you prioritize, which comparator you run against, which biomarker-defined slice you enrich. This is the highest-return internal move a challenger can make, and it matters most for the early-stage assets spreading a thin Phase-1 budget across a multi-tumor basket: running everywhere signals nothing and clears no bar. Concentrating that budget on the one arena where you can actually beat the ivo-anchored frontier — an under-served carve-out, a biomarker-defined population, a combination the leader can’t or won’t run — is what converts a pooled me-too into a genuinely differentiated asset. Indication prioritization isn’t back-office clinical ops; on this board it is the primary value-creation lever a seller controls, and the one that happens well before any banker is called. Positioning sells the asset you have; clinical prioritization builds a better one to sell.
If you’re likely a me-too, move first. The last of the froth goes to whoever transacts before lemon-pricing sets in.
C8. China rights & deal structure
Almost every asset here is Chinese-originated, and that shapes structure more than any valuation number.
The rights are already split. Most of these assets are licensed by region: a Chinese partner holds Greater China, and the originator (or a Western co) retains ex-China or global rights. A buyer is usually acquiring ex-China rights, not the molecule outright. That includes the Summit case: a take-out buys Summit’s ex-China territory while Akeso keeps developing in China in parallel. The parallel development generates data and de-risks the mechanism, but the buyer doesn’t control the whole program, and China-run trials may or may not support a Western filing.
Data portability is the gating question. The sintilimab ODAC vote turned on whether China-generated data can carry a US approval. For any asset whose evidence is China-heavy, the diligence question isn’t only “is the data good” but “will FDA take it, and what confirmatory Western data is still owed.” That owed data is real cost and time the buyer funds after signing — plausibly a few hundred million and 2–4 years for a Western confirmatory program, already inside the “minus residual development cost” term of the C3 model.
BIOSECURE and CFIUS are live overhangs. Building a flagship IO franchise on a Chinese-originated molecule carries political risk a 2026 board will weigh: supply-chain and data-security scrutiny under BIOSECURE, and CFIUS exposure if a structure reaches the China entity or its data. None of it kills a deal; all of it shapes structure and price.
The instruments follow. This class has been licensed, not acquired. BMS/BioNTech, Pfizer/3SBio, Merck/LaNova, AbbVie/RemeGen were licensing or collaboration deals, with upfronts a fraction of the headline deal value and the rest tied to milestones. Summit is the one plausible acquisition, and even that buys only a territory. So the menu isn’t “buy vs. wait.” It’s license vs. co-develop vs. acquire-the-territory, structured with upfront/milestone/royalty splits, readout CVRs, and China carve-out terms. Pricing assets without pricing structure gets you half the answer.
Method & sources
This is a coarse, provisional, uncertainty-native landscape read, not a valuation opinion. Dollar figures are modeled risk-adjusted NPV estimates over ex-China commercial territory, presented as wide ranges because the inputs (peak share, probability of success, class-failure) are themselves uncertain; they are not forecasts and should not be quoted as point estimates. Clinical readouts, deal terms, and regulatory dates are sourced to primary disclosures; the archetype values and the class-failure estimate are model outputs and are explicitly unratified. Where a datum is undisclosed, it’s marked as a gap, not imputed.
Sources. Every clinical readout, deal term, and regulatory event cited above is listed in the References below, each with a link back to the paragraph where it’s used. The class deal comps are tabulated in the deal-comps appendix.
Appendix — the PD-(L)1×VEGF deal comps
The class-defining deals, terms as disclosed, grouped by stage (earliest to latest) — because that’s the axis that moves the price. These are the comps the archetype values in C2 / C3 are anchored to — pre-data, an asset is priced off a real deal at that state, not a probability-weighted blend of resolved outcomes.
Read the upfront column, not the headline total. The upfront is the apples-to-apples number — cash actually paid, at risk, the day the deal signs. The “total deal value” is a milestone-loaded promise that is itself already probability-discounted (most of it only pays out on regulatory and sales successes that mostly won’t happen). The last column risk-adjusts the total back — upfront + a stage-appropriate probability × the milestones — which is the honest expected cost and the right thing to compare across stages (and against the acquisition values elsewhere in the piece).
Grouped this way the escalation is clean: upfronts run ≈$0.5–0.65B at Ph1, ≈$0.5–1.25B at Ph2, $1.5B at Ph3, and the risk-adjusted totals roughly double the upfront at Ph1–2 and ~3.5× it at Ph3 (milestones only start to count once the asset is close enough to earn them). Risk-adjusting uses coarse stage LOAs (Preclin ~5%, Ph1 ~10%, Ph2 ~20%, Ph3 ~40%); it is an estimate, flagged as such. For scale, the pre-2024 norm for a same-stage bispecific was a fraction of these — very roughly ≈$1B (Ph1) to ≈$3–4B (Ph3) in total deal value (estimated, pending a sourced comp set). The class deals cleared several times that — the froth premium that C3 discounts back out.
Appendix — the limitation scorecard: our model vs the Street, and what would have to be wrong to matter
This piece is built from our own competitive model, not consensus, so this scorecard is explicit about where each input sits versus external sources, which value the analysis actually uses, and how far each input would have to be wrong before a conclusion changes. We got the last column by running the model’s own value-of-information logic on itself: sweep each input across (and beyond) its disagreement range and watch when any of five load-bearing conclusions first flips — (1) ivonescimab is the most valuable single asset, (2) the frontier is contested rather than a runaway, (3) competition compresses the leader’s value even in success, (4) the cap reconciles to an implied success probability near 0.4, and (5) the blind Phase 3 is the top information target. The result: no single input, moved on its own within its plausible range, flips any of the five. Three inputs (P(class works), ex-China NPV, competition saturation) flip a conclusion only at values beyond their plausible ranges (below ~0.20, 0.35×, and 0.40 respectively). We also ran the harder test — two adverse-but-plausible moves at once — and four of the five hold even in a triple-adverse world. The one that can flip is (1): if the fast-followers are genuinely at parity with ivonescimab (which their Phase 2 ORR arguably supports) and class-PoS sits at the market’s ~0.55, ivonescimab and its best challenger converge to a near-tie on expected value — a ~1.8× lead at baseline, ~1.0× in that world. That is not a contradiction of this piece; it is its “contested, not settled” thesis, sharpened. Two inputs move the magnitude of the answer and are worth pinning; the rest are too insensitive to source precisely, and we say so. What the sweep cannot test are the structural choices beneath it — the zero-sum share model, ivonescimab as the frontier anchor, the single-factor form of the correlation, and where we draw the “class works” line — those are assumptions, not results, and a reader should weigh them as such.
Input
Our model
External sources (range)
What the analysis uses
Impact
How wrong to flip a conclusion
Maturity
Ex-China peak / unadj. NPV
$28B competed · $40B monopoly (if-success)
peak ≈$6.5–7B (Inflection, Truist “conservative”) → NPV ≈$20–35B at 3–5×; Jefferies ≈$10B is global22
competed ≈$28B (~4× peak); monopoly flagged as a ceiling
#1 (0.12)
TAM must fall to 0.35× (≈$2.3B peak) to break the cap reconciliation — well below the external range
must fall to ~0.20 — below even the bear case — before “contested frontier” flips; nothing else flips
triangulated (we sit high)
Fast-follower strength (contested frontier)
SSGJ-707 / JS207 ~35% chance of beating ivo
Ph2 NSCLC ORR: SSGJ-707 ~62%20, JS207 ~58%21 vs ivonescimab ~50% — at or above
~35% — discounted below the raw ORR edge for ivo’s randomized-data advantage
drives #2/#3
external data would have to reverse (fast-followers well below ivo) — it currently points the other way
validated (arguably conservative)
Competition-share model
zero-sum, order-of-entry, saturation 0.95
Regnier–Ridley / Urban order-of-entry literature (≈0.34 share for a 2-yr-late 2nd entrant)23
the literature curve + saturation 0.95
#3 (0.06)
saturation must drop to 0.40 (from 0.80–0.95 plausible) to break the cap reconciliation
literature-based
Correlated class risk (ρ)
efficacy ρ ~0.79 (loaded from pathway overlap)
— sensitivity too low to justify sourcing
the loaded ρ
#5 (0.03)
robust to ρ = 0.999 — no value, however extreme, flips any conclusion (it governs the joint tail, not the leader/frontier)
low-impact (deprioritized)
Trispecific safety cost
a modest (~12%) value penalty when it wins; dropped when it only ties or loses, where the extra mechanism is pure liability
— needs-source; sensitivity too low to justify sourcing
0.12, banded 0.05–0.20
#4 (0.04)
robust to 0.55 — the kill-floor is structural, so the cost’s exact size can’t move a load-bearing conclusion
estimated (low-impact)
Early / no-data footprints
domain estimate for the Ph1 tail
— needs-source; negligible
the estimate
#6 (0.00)
the entire tail is worth almost nothing — dropping it moves no conclusion
estimated (negligible)
How to read it. The two anchored/triangulated rows are where the work is: the ex-China NPV is externally supported at the competed figure (the monopoly is a ceiling), and our P(class works) sits above the market — we flag that we are the optimists and think the Street is nearer right. The contested-frontier claim is the one new, model-generated conclusion, and external Phase 2 data supports it (if anything the model is conservative). Everything below the line is deliberately left at an estimate: not because the truth doesn’t matter in principle, but because we checked, and no plausible value changes the answer. In particular, the tempting “we underestimate correlated class risk” critique is real as a description but ranks second-to-last: correlation governs whether the class fails together — a concern for a basket buyer, or for anyone still deciding whether to step into the space at all — while every conclusion here turns on the leader and the frontier, whose value depends on the marginal probability the bet works, the row above it.